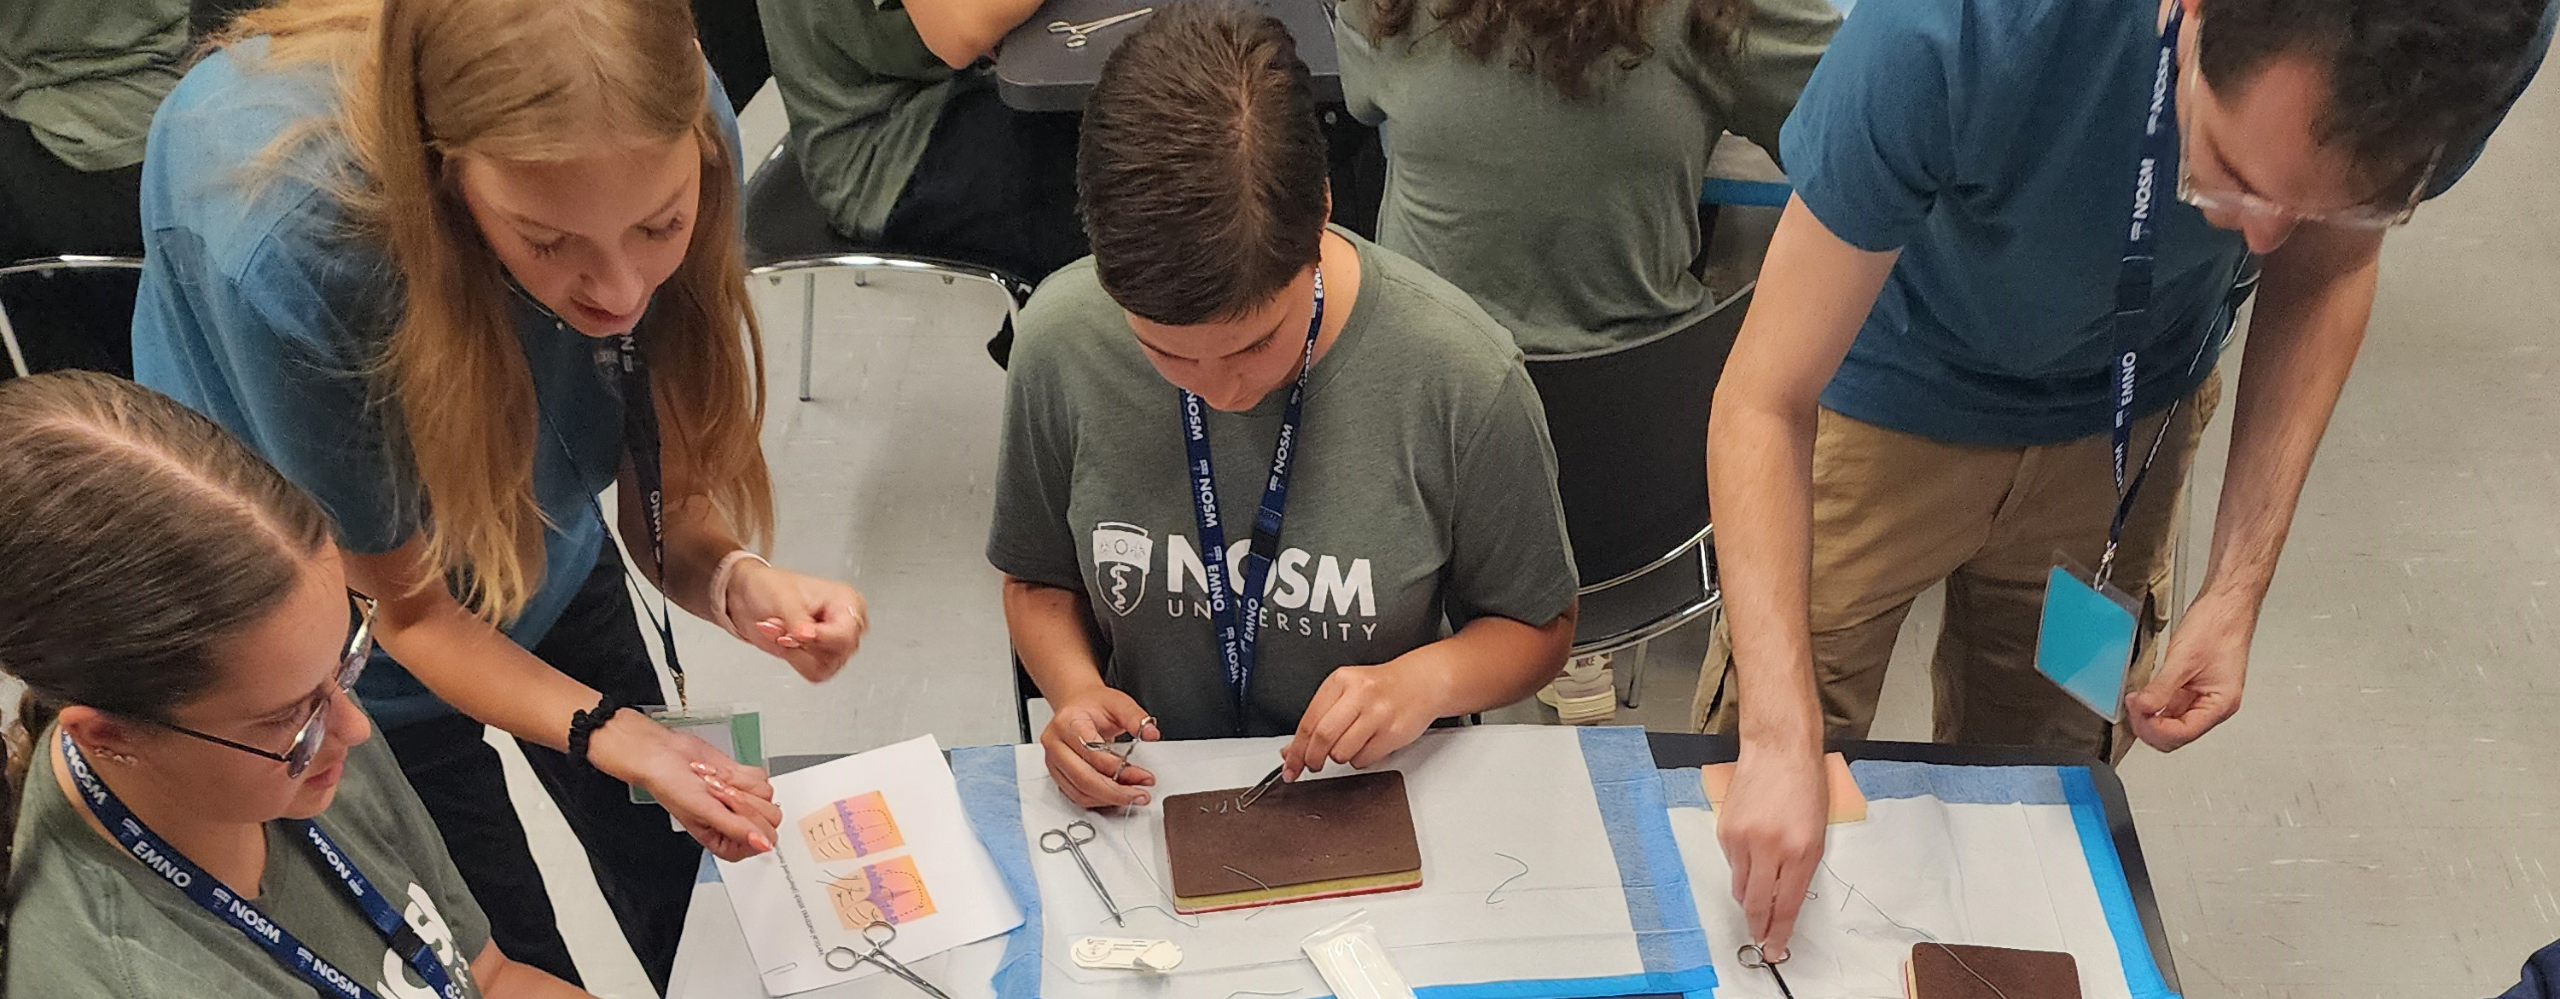
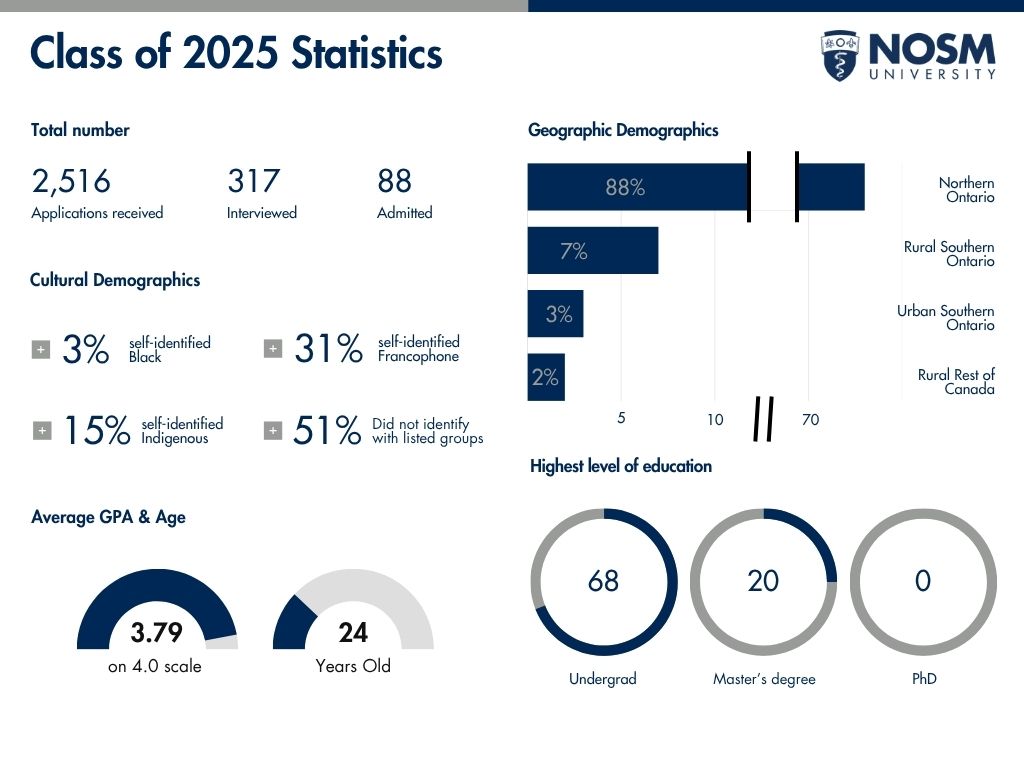
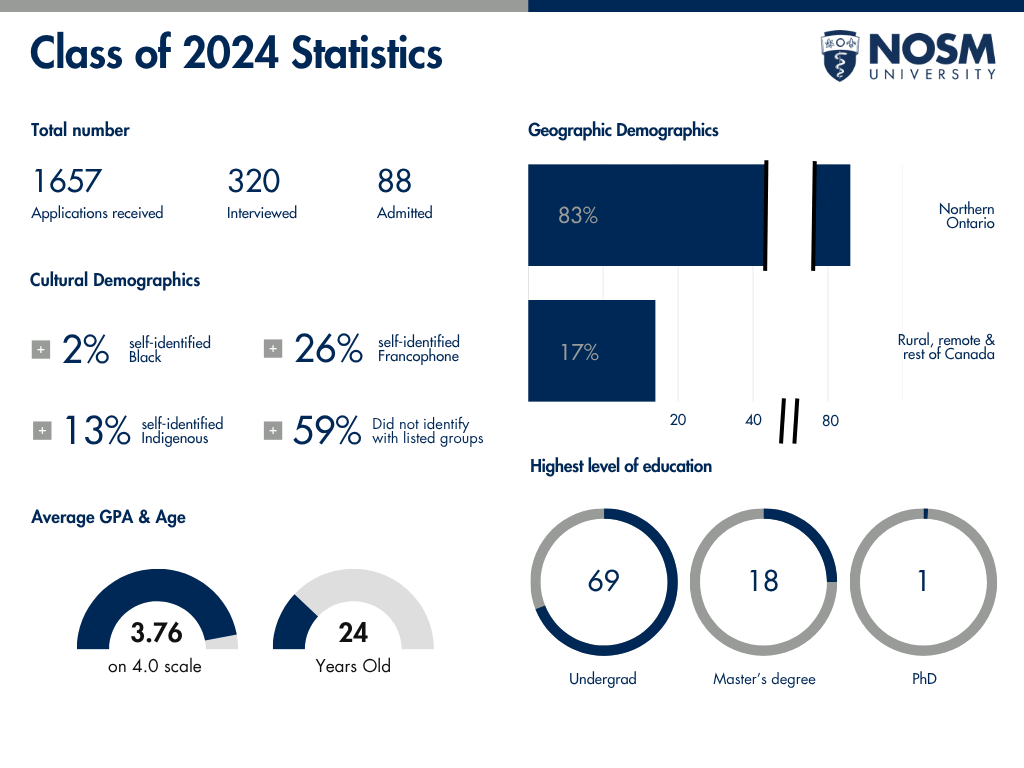
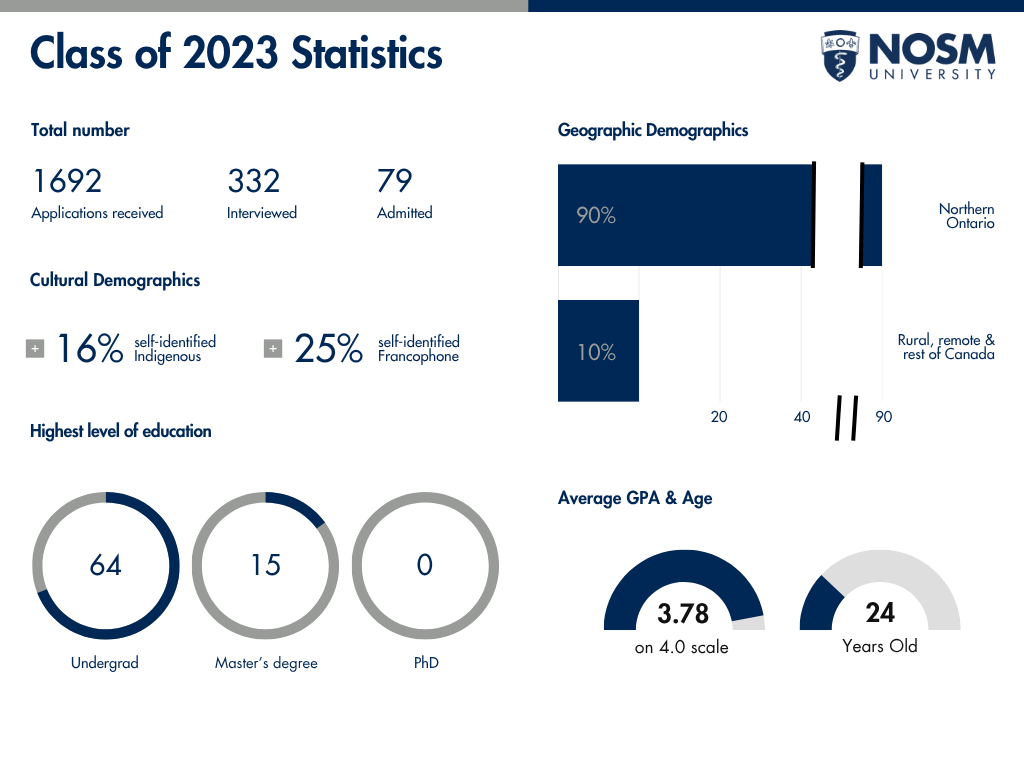
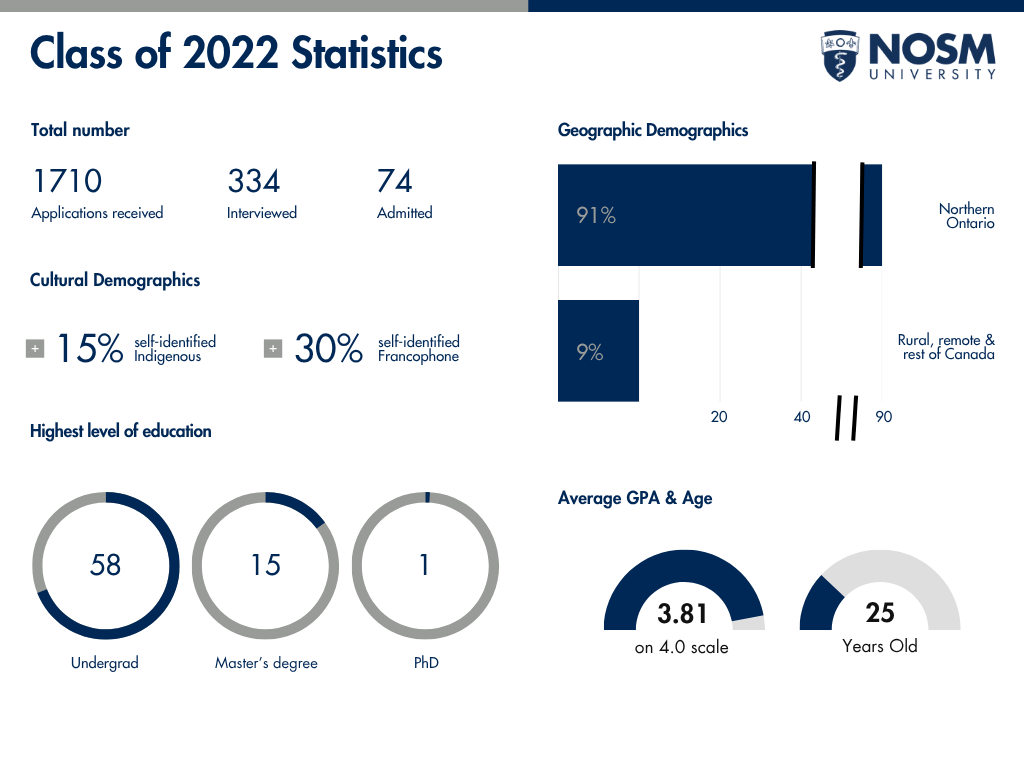
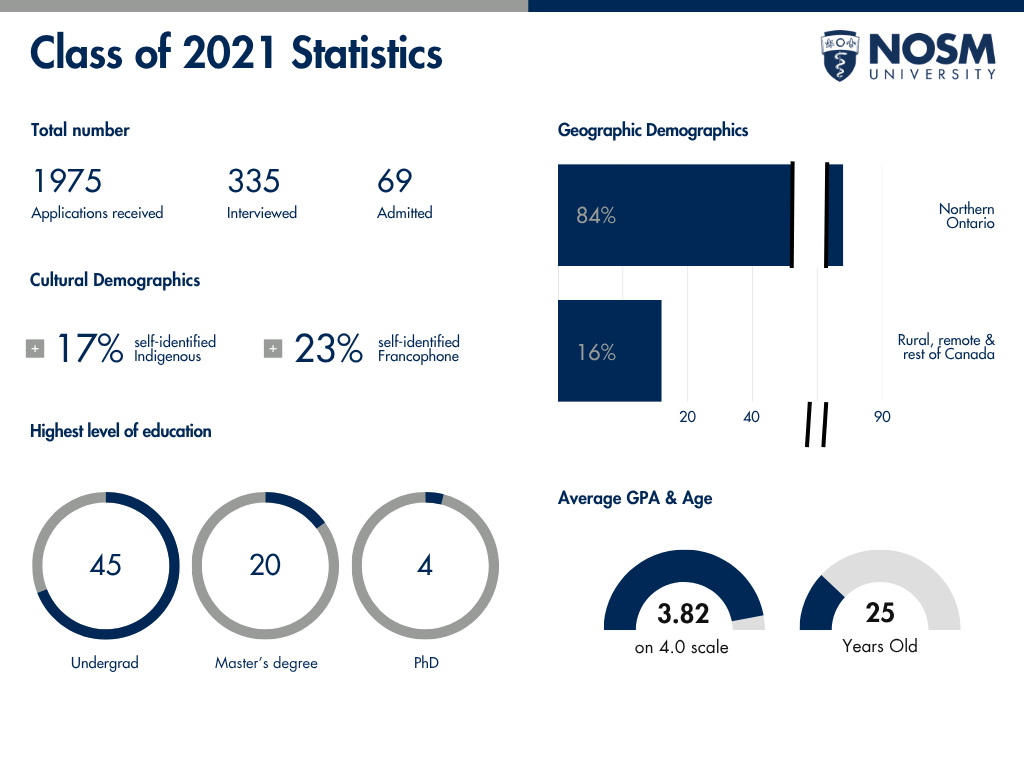
Donate Now!

Class Profiles

On this page you will find information on entering class statistics for NOSM University’s Undergraduate Medical Education (UME) Program (MD Degree) over the past five (5) years, as well as the statistics for the Entering Class of 2023.


Summary Chart for Entering Classes – Past Five (5) Years


Chart displaying Class Profile Statistics: Class Year 2023; Total Number of Applications Received - 1,692; Total Number Interviewed - 332; Total Number of Places in Class - 79; Average GPA (on a 4.0 scale) - 3.78; Number of Students with a PhD - 0; Number of Students with a Master's degree - 15; Average Age - 24 years; Number of Self-identified Indigenous Students - 13 (16%); Number of Self-identified Francophone Students - 20 (25%); Number of Students from Northern Ontario - 70 (90%); Number of Students from rest of Canada (majority from Rural and Remote Areas) - 8 (10%). NOTE: 1 of the E2023 incoming students is a supernumerary MMTP seat and because context score is not an admission factor for these students, they are not included in the rurality statistics for this class. All percentages for the Northern Ontario/rural/remote areas are calculated based on 78 seats.


Entering Class of 2023 Statistics


  • A total of 1,692 applications were received
  • 332 applicants were interviewed
  • There were 791 places in the class
  • The average GPA of the members of the class was 3.78 (on a 4.0 scale)
  • In the class there were 0 students with a PhD
  • In the class there were 15 students with a Master’s degree
  • The average age of the members of the class was 24 years
  • There were 13 self-identified Indigenous students (16%) in the class
  • There were 20 self-identified Francophone students (25%) in the class
  • In the class there were 70 students (90%) from Northern Ontario
  • In the class there were 8 students (10%) from the rest of Canada (majority from rural & remote areas)

1One (1) of the E2023 incoming students are supernumerary MMTP seats and because context score is not an admission factor for these students, they are not included in the rurality statistics for this class. All percentages for the Northern Ontario/rural/remote areas are calculated based on 78 seats.


Entering Class of 2023 Geographic and Cultural Demographics


Entering class of 2023 Geographic and Cultural demographics bar graph: white columns on dark blue background representing: 13 out of 79 (16%) self-identified Indigenous students; 20 out of 79 (25%) self-identified Francophone students; 70 out of 78 (90%) students from Northern Ontario; and 8 out of 78 (10%) students from the rest of Canada (majority from rural and remote areas).


Entering Class of 2023 Application Demographics


Entering class of 2023 Application Demographics bar graph: white columns on dark blue background representing 1,692 applications received; 332 applicants interviewed; and 79 seats in the class.